Have you ever stared at a lab report, confused by two different numbers that seem to say opposite things about your health? You might have an A1C result that looks perfect, yet your daily glucose meter shows frequent highs or lows. Or perhaps your daily averages look decent, but your A1C is higher than expected. This disconnect isn’t just confusing; it can be dangerous if you don’t understand why it happens.
The core issue lies in how we measure blood sugar over time. A1C (glycated hemoglobin) is a blood test that measures your average blood glucose levels over the past 2-3 months. It’s the gold standard for diagnosing and monitoring diabetes. However, it doesn't tell the whole story. Meanwhile, average glucose is the mean of your daily blood sugar readings, often derived from fingerstick tests or continuous glucose monitors (CGM). Understanding the difference between these two metrics is crucial for effective diabetes management.
How A1C Works: The Long-Term Snapshot
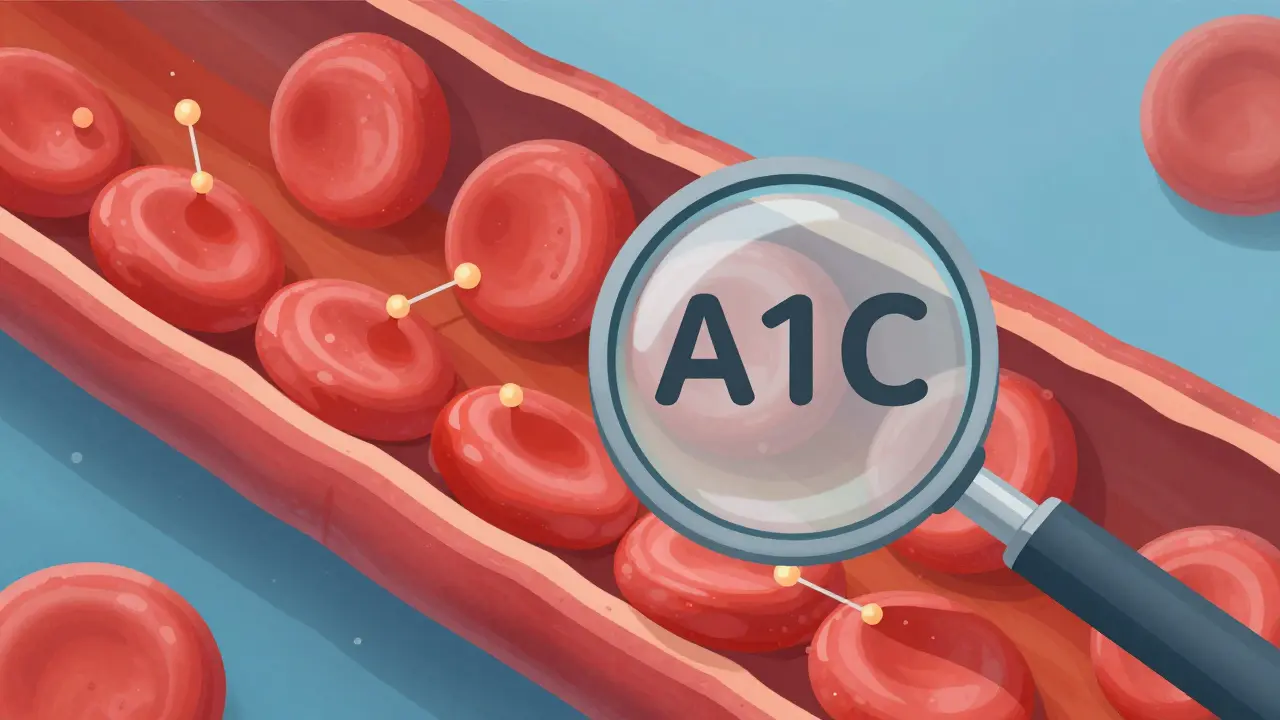
To understand A1C, you need to know what’s happening inside your red blood cells. Glucose in your bloodstream sticks to hemoglobin, the protein in red blood cells that carries oxygen. Once attached, it stays there for the life of the cell, which is about 120 days. The A1C test measures the percentage of hemoglobin that has glucose attached to it.
This makes A1C a powerful tool because it smooths out daily fluctuations. Unlike a single fingerstick reading, which only tells you your blood sugar at that exact second, A1C gives you a weighted average of your glucose control over roughly 8 to 12 weeks. Recent studies show that the most recent month accounts for about 50% of your A1C value, while the previous two months make up the rest.
The American Diabetes Association (ADA) adopted A1C ≥6.5% as a diagnostic criterion for diabetes in 2010. For most adults with diabetes, the target is an A1C below 7.0%. This metric became the industry standard after the Diabetes Control and Complications Trial (DCCT) in 1993 proved that lower A1C levels significantly reduce the risk of complications like nerve damage, kidney disease, and vision loss.
Estimated Average Glucose (eAG): Speaking Your Language
Percentages can feel abstract. When you check your blood sugar with a meter, you see numbers like 120 mg/dL or 180 mg/dL. To bridge this gap, clinicians use estimated average glucose (eAG), which is a conversion of your A1C percentage into the same units (mg/dL) used by glucose meters.
The formula for this conversion, established by the ADAG study published in 2008, is straightforward:
- eAG (mg/dL) = (28.7 × A1C) - 46.7
For example, if your A1C is 7.0%, your eAG is approximately 154 mg/dL. If your A1C is 8.0%, your eAG is around 183 mg/dL. This helps patients visualize what their long-term control looks like in familiar terms. It’s not a new measurement; it’s just a translation of the A1C data.
| A1C (%) | eAG (mg/dL) | Clinical Interpretation |
|---|---|---|
| 6.0% | 126 mg/dL | Normal / Pre-diabetes threshold |
| 7.0% | 154 mg/dL | Standard target for many adults |
| 8.0% | 183 mg/dL | Elevated risk for complications |
| 9.0% | 212 mg/dL | Significantly elevated |
| 10.0% | 240 mg/dL | High risk zone |
GMI vs. A1C: The CGM Revolution
If you use a continuous glucose monitor (CGM), such as Dexcom or Freestyle Libre, you’ve likely seen another number: Glucose Management Indicator (GMI). GMI is calculated directly from your CGM data using a similar formula to eAG, but it reflects your actual sensor readings over a specific period (usually 14 to 90 days).
Here is where things get tricky. Many people find that their GMI and their lab A1C do not match. A 2021 study analyzing over 5,000 patients found significant discrepancies between the two. Why does this happen?
- Different Measurement Methods: A1C is measured in a lab based on chemical reactions in your blood sample. GMI is a mathematical estimate based on interstitial fluid glucose readings from your sensor.
- Biological Variability: Conditions like anemia, kidney disease, or pregnancy can affect red blood cell turnover, making A1C inaccurate. In these cases, GMI may be a more reliable reflection of your true average glucose.
- Time Lag: Sensors measure glucose in the fluid around your cells, which lags behind blood glucose by a few minutes, especially during rapid changes.
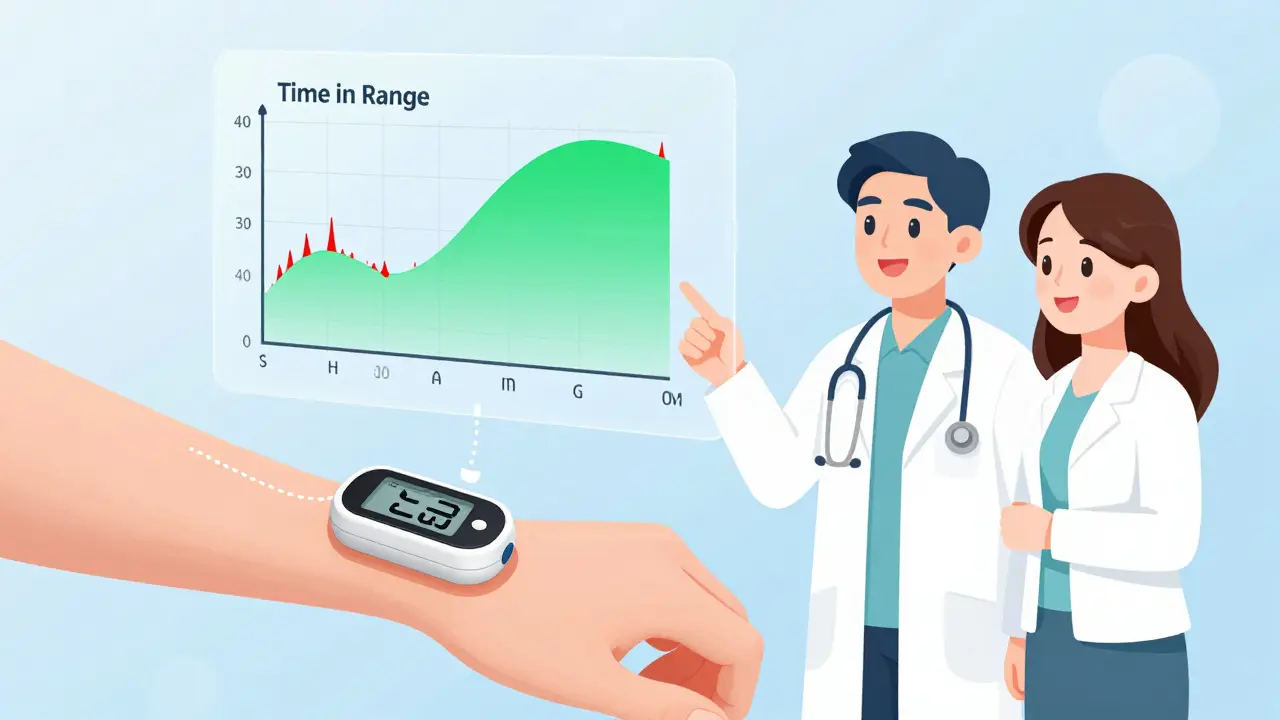
Dr. Richard Bergenstal, a leading expert in diabetes technology, emphasizes that Time in Range (TIR) should be the primary metric for CGM users, with A1C serving as a secondary confirmation. TIR measures the percentage of time your glucose spends between 70 and 180 mg/dL. The ADA recommends a TIR of ≥70% for most adults.
Why Your Numbers Might Disagree
You might be thinking, "My daily average looks fine, so why is my A1C high?" or vice versa. Several factors contribute to this mismatch.
The Averaging Effect: A1C hides variability. Imagine spending half the day at 60 mg/dL (low) and half the day at 240 mg/dL (high). Your average might be 150 mg/dL, which looks okay. But your body experienced dangerous swings. A1C will reflect the high exposure to glucose, potentially resulting in a higher number than your simple arithmetic average suggests. More importantly, those swings increase cardiovascular risk, which A1C alone doesn’t fully capture.
Hemoglobin Variants: Certain genetic traits or medical conditions alter how hemoglobin binds to glucose. People with sickle cell trait, thalassemia, or iron deficiency anemia may have falsely low or high A1C results. In these scenarios, doctors often rely on fructosamine tests or CGM-derived GMI instead.
Postprandial Spikes: If you check your blood sugar only when fasting, you might miss the sharp spikes that occur after meals. These post-meal highs contribute significantly to A1C but won’t show up in a fasting log. This is why CGM data is superior-it captures every minute of the day.
Setting Personalized Targets
There is no one-size-fits-all target for A1C or average glucose. The ADA’s 2023 Standards of Care emphasize glycemic individualization. Factors like age, duration of diabetes, history of hypoglycemia, and other health conditions play a huge role.
- Younger, healthier adults: May aim for an A1C <6.5% (eAG <126 mg/dL) to prevent long-term complications.
- Older adults or those with comorbidities: May have a relaxed target of <8.0% (eAG <183 mg/dL) to avoid dangerous low blood sugar episodes.
- Pregnant women: Typically require tighter control, often targeting an A1C <6.0% or even lower, depending on trimester and provider guidance.
It’s also critical to look at Time Below Range (TBR). Spending too much time under 70 mg/dL is dangerous, regardless of your A1C. A person could have a perfect A1C of 6.5% but spend 10% of their day in hypoglycemia. That is not success; that is a safety hazard.
Actionable Steps for Better Management
So, what should you do with this information? Here is a practical checklist to align your daily habits with your lab results.
- Compare GMI and A1C: If you use a CGM, compare your GMI to your lab A1C every three months. If they differ by more than 0.5%, discuss this with your doctor. It might indicate a need for a different testing method.
- Focus on Time in Range: Aim for >70% of your day between 70-180 mg/dL. Use your CGM reports to identify patterns. Are you spiking after breakfast? Dropping at night? Address specific times rather than just chasing an average.
- Check for Anemia: If your A1C seems inconsistent with your daily readings, ask your doctor to check your iron levels and complete blood count. Iron deficiency can skew A1C results.
- Review Medication Timing: Sometimes, medication dosages need adjustment based on CGM trends, not just A1C. Share your CGM data with your healthcare provider before appointments.
- Don’t Ignore Hypoglycemia: If you’re having lows, tell your doctor immediately. Lowering your A1C by increasing insulin or medication without addressing the lows is risky.
Frequently Asked Questions
What is the difference between A1C and average glucose?
A1C is a laboratory test that measures the percentage of hemoglobin in your blood that is coated with sugar, reflecting your average blood glucose over the past 2-3 months. Average glucose is the arithmetic mean of your daily blood sugar readings, typically obtained from fingerstick tests or continuous glucose monitors (CGM). A1C provides a long-term view unaffected by daily fluctuations, while average glucose gives a snapshot of your current control.
Why is my GMI different from my A1C?
GMI (Glucose Management Indicator) is calculated from CGM sensor data, while A1C is measured from a blood sample in a lab. Differences can arise due to biological factors like anemia or kidney disease affecting red blood cell lifespan, or technical differences in how sensors measure interstitial fluid versus blood plasma. A discrepancy of more than 0.5% warrants a discussion with your healthcare provider.
Can I calculate my estimated average glucose (eAG) at home?
Yes, you can use the formula: eAG (mg/dL) = (28.7 × A1C) - 46.7. For example, if your A1C is 7.0%, your eAG is 154 mg/dL. Many online calculators and diabetes apps also perform this conversion automatically for convenience.
Is a lower A1C always better?
Not necessarily. While lower A1C reduces the risk of long-term complications, aiming too low can increase the risk of severe hypoglycemia (low blood sugar), which can be dangerous, especially for older adults or those with heart conditions. Targets should be personalized based on age, health status, and hypoglycemia awareness.
How often should I get my A1C tested?
The American Diabetes Association recommends testing A1C at least twice a year for patients who are meeting treatment goals and stable. If your treatment plan changes or you are not meeting your glucose targets, you should be tested quarterly (every three months).
Does diet affect A1C immediately?
No, A1C reflects a 2-3 month average. Changes in diet will impact your daily glucose readings immediately, but it takes several weeks for these changes to significantly shift your A1C result. Consistency over time is key to improving A1C.